Tutorial#
This notebook will guide a user through using CellSAM. More details on CellSAM can be obtained at the preprint: https://www.biorxiv.org/content/10.1101/2023.11.17.567630v3
For biologists, we recommend using cellsam_pipeline(),
which accepts an image, automatically downloads weights, and returns a mask.
cellsam_pipeline has additional functionality (e.g., postprocessing,
normalization, contrast enhancement), but can often be used out of the box.
For machine learning practitioners or users with more esoteric use-cases, we
provide direct access to the model and weights through get_model.
For more information or additional assistance, feel free to get in touch.
import imageio.v3 as iio
import numpy as np
import scipy as sp
import matplotlib.pyplot as plt
import matplotlib.patches as patches

from cellSAM import cellsam_pipeline, get_model
from cellSAM.utils import format_image_shape, normalize_image
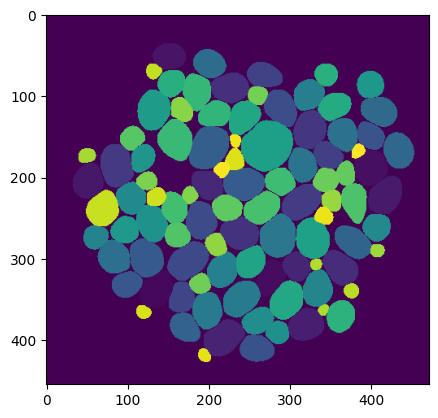
Finding all cells using CellSAM#
First, let’s see how one can directly use cellsam_pipeline()
to predict all the masks in an image.
We’ll load a sample image and pass it through the inference pipeline.
When bounding boxes aren’t provided, the CellFinder module automatically finds
bounding boxes for all the cells.
The inference pipeline will make use of a GPU if one is found and fall back to
CPU if not.
Note
Although CellSAM will still work on a CPU, it will be quite slow if there are a large number of cells.
# Load sample data and trim padding
img = iio.imread("../sample_imgs/YeaZ.png")[8:-7, 8:-7]

# Run inference pipeline
mask = cellsam_pipeline(
    img, use_wsi=False, low_contrast_enhancement=False, gauge_cell_size=False
)

# Visualize results
plt.imshow(mask);
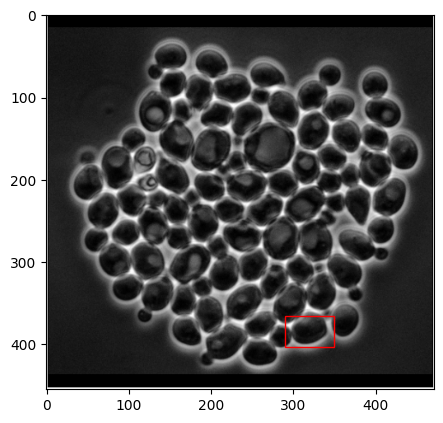
Prompting CellSAM#
Note
Check out the napari plugin for a more convenient interface to interactive segmentation!
What if we want to label specific cells? This is a natural outcome if we use CellSAM as a data engine to accelerate labeling for new morphologies or cell types. Let’s pick out a specific box and show how we can segment only that cell. We’ll use the model directly.
# Here's the cell we want to segment!
box = [290, 365, 60, 38] # x, y, w, h

rect = patches.Rectangle(
    (box[0], box[1]), box[2], box[3], linewidth=1, edgecolor='r', facecolor='none'
)

plt.figure(figsize=(5, 5))
plt.imshow(img, cmap='gray')
plt.gca().add_patch(rect);
predictor = get_model()

# We can pass the bounding boxes to the model prediction function
x1, y1, w, h = box

# Bounding-box prompts should have format (x1, x2, y1, y2), where (x1, y1) is
# the lower-left corner of the box and (x2, y2) is the upper right
x2, y2 = x1 + w, y1 + h

# Preprocess the image
im = format_image_shape(img)
im = normalize_image(im)
im = np.transpose(im, (2, 0, 1))
im = np.expand_dims(im, axis=0)
pred_mask, *_ = predictor.predict(im, boxes_per_heatmap=[[[x1, y1, x2, y2]]])
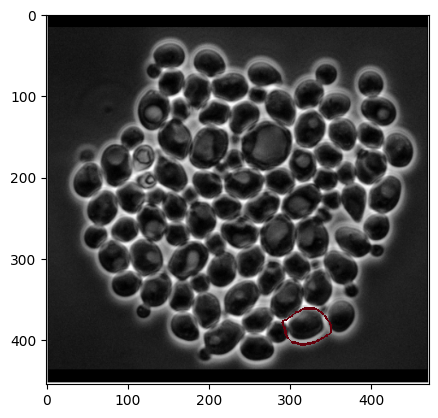
Now, let’s visualize the predicted mask. We’ll superimpose the mask as an edge onto our image to see it more clearly
# Use several iterations to make the mask edge visible when plotting
dilated_mask = sp.ndimage.binary_dilation(pred_mask > 0, iterations=5)
edges = (dilated_mask > pred_mask).astype(np.uint8)

# Plot the image
plt.imshow(img, cmap="gray")

# And the outlines from the mask
plt.imshow(255 * edges, cmap="Reds", alpha=edges);
And that’s it! For more info on CellSAM, feel free to reach out or check out the official deployment at https://cellsam.deepcell.org.